
Global Counterfeiting Statistics 2026: Fake Trade Hits USD 467 Billion
sourceOECD/EUIPO Mapping Global Trade in Fakes 2025; ICC BASCAP/Frontier Economics (2017)
publisherQSDEFENDER Editorial Team
time2026/09/27
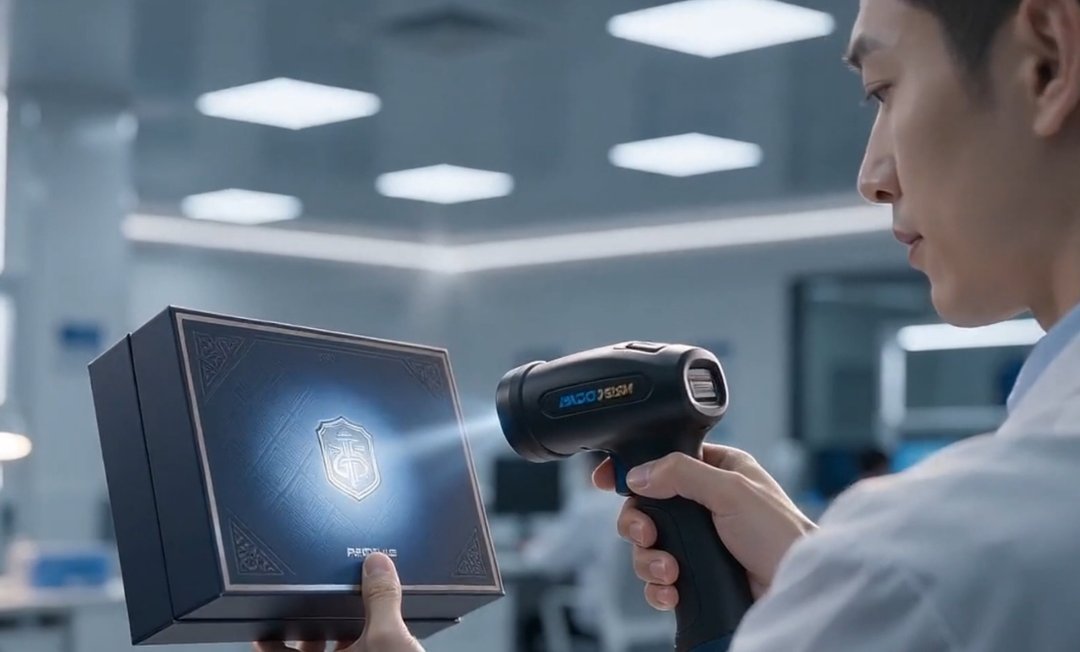
- The OECD and EUIPO's Mapping Global Trade in Fakes 2025 puts global counterfeit trade at USD 467 billion in 2021, 2.3% of world imports, with the EU absorbing USD 117 billion. This summary distills the measured figures, the small-parcel and localization trends behind them, the ICC BASCAP projection brands also quote, and the label decisions that follow.
Every brand-protecting budget written in 2026 starts from the same question: how big is the fake-goods economy we are actually fighting? The most defensible answer available today comes from the OECD and the European Union Intellectual Property Office, whose joint study Mapping Global Trade in Fakes 2025 remains the reference dataset behind the global counterfeiting statistics 2026 planners cite. This summary pulls out the numbers that matter for brand owners, separates measured data from projections, and translates both into actions on the label.

The scale of the fake trade is why the scan moment on your product matters: every verdict page is a data point in this fight.
The Headline Numbers, Straight From the Source
The fourth joint OECD/EUIPO study, published in May 2025, analyzed 2021 global customs seizure data combined with UN Comtrade trade statistics. Its central estimates:
| Indicator | Figure | What it covers |
|---|---|---|
| Global trade in counterfeit goods | USD 467 billion (2021) | 2.3% of total world imports |
| Counterfeit imports into the EU | USD 117 billion | 4.7% of total EU imports |
| Previous measurement (2019 data) | USD 464 billion | 2.5% of world trade |
| Product categories affected | Nearly 50 of 96 | Clothing, footwear, leather goods and electronics lead |
| Seizures as small parcels / mail | ~65% | Postal channels now the primary distribution route |
| Seized shipments of fewer than 10 items | 79% | Up from 61% in 2017–19 |
| Dominant provenance economies | China and Hong Kong (China) | Türkiye the second-largest source |
Two readings of the table matter for planning. First, the absolute value of the fake trade grew from 2019 to 2021 even as its share of world trade slipped from 2.5% to 2.3% — global trade itself grew faster than counterfeiting, but the underground economy did not shrink. Second, the EU absorbs a disproportionate share: at 4.7% of imports, fake goods enter Europe at roughly twice the global average rate, which is why EU enforcement news keeps landing on brand owners' desks. For anyone assembling global counterfeiting statistics 2026 decks, these two numbers — the world figure and the EU figure — are the anchor pair to quote.
What Changed in the Trend Lines
The structural shifts documented in the report explain why yesterday's anti-counterfeiting playbook underperforms today:
- The small-parcel economy. With about 65% of seizures now small parcels and mail, counterfeiters exploit de minimis thresholds and the sheer volume of e-commerce consignments. A single fake listing no longer ships a container; it ships thousands of envelopes that individually evade scrutiny.
- Localization of production. Counterfeiters increasingly ship unassembled parts or separate packaging and finish assembly close to the destination market, shortening the detectable cross-border leg. Free trade zones, with reduced oversight, play a pivotal role.
- More routes, more waterways. The report documents diversification beyond container ports — including river routes such as the Danube — as enforcement concentrates on traditional lanes.
- Dangerous fakes on the rise. Beyond luxury goods, authorities flag counterfeit automotive parts, pharmaceuticals, electrical chargers, toys and alcohol — categories where the failure mode is injury, not just disappointment.
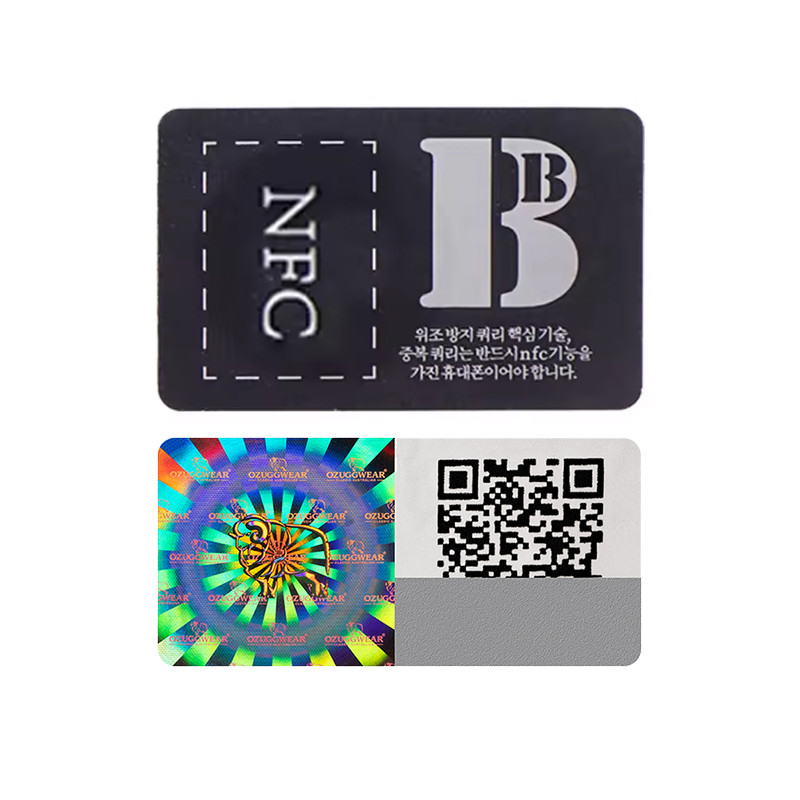
Layered label construction — NFC, holographic and QR elements on one sticker — reflects how brand protection has responded to diversified counterfeit channels.
The Wider Cost Estimate Brands Also Quote
Alongside the OECD's measured customs data, the figure most often quoted in 2026 board decks comes from a different lineage: The Economic Impacts of Counterfeiting and Piracy, prepared by Frontier Economics for the International Chamber of Commerce's BASCAP initiative and INTA in February 2017. It projected that counterfeiting and piracy would drain up to USD 4.2 trillion from the global economy and put 5.4 million legitimate jobs at risk by 2022, counting not just the trade value of fakes but displaced economic activity, fiscal losses and enforcement costs. Treat it as what it is — a 2017 projection built on 2013 data — and cite it as context, not as a measurement. The OECD/EUIPO series is the one built on actual seizure records.
From Statistics to Label Decisions
Numbers do not stop a counterfeit; a verifiable product identity does. The trends behind the global counterfeiting statistics 2026 teams are quoting point to three concrete moves:
- Serialize every sellable unit. A unique code per item is the precondition for any verdict, alert, or scan-count anomaly detection. The system design is laid out in our 2026 QR anti-counterfeit implementation playbook.
- Make the code dynamic, not decorative. A printed static pattern can be copied by the same small-parcel channels described above; a server-resolved code cannot be faked by copying ink. The enforcement angle — what regulators now expect of serialized supply chains — is covered in our EU FMD 2026 & DSCSA enforcement update.
- Audit the label before counterfeiters do. Most scanning failures we see in the field trace back to a handful of recurring print and deployment mistakes; the shortlist is in five QR code mistakes that let counterfeiters copy you.
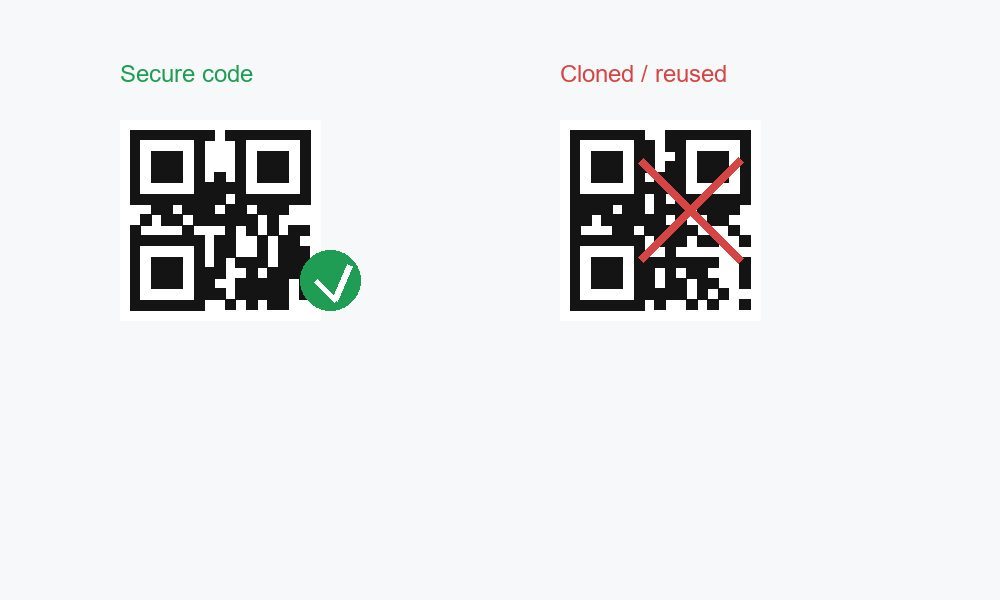
One code per unit: the countermeasure that turns global counterfeiting statistics into per-scan, per-batch evidence a brand can act on.
Honest Boundaries of This Summary
The USD 467 billion, USD 117 billion, 2.3%, 4.7%, 65% and 79% figures are OECD/EUIPO estimates derived from 2021 customs seizure data, published May 2025 — the latest measured dataset available as of September 2026, not a 2026 observation. The USD 4.2 trillion figure is a 2017 projection, not a measured outcome. Figures for provenance shares and category coverage describe seized goods, which understate total illicit trade. QSDEFENDER does not publish client-specific seizure or scanning metrics, and nothing in this summary should be read as a guarantee of detection outcomes for an individual deployment.
Get the One-Page Digest
We maintain a one-page digest of the OECD/EUIPO findings plus a short "what to check on your label" checklist for brand teams. Send an inquiry with the subject "Report Summary" and we will share it, or contact us to discuss how serialization fits your product line.
Sources: OECD/EUIPO, Mapping Global Trade in Fakes 2025: Global Trends and Enforcement Challenges (May 2025, 2021 customs data) — oecd.org publication page; EUIPO announcement — euipo.europa.eu; OECD blog on the report's findings — oecd.org blog; ICC BASCAP / INTA / Frontier Economics, The Economic Impacts of Counterfeiting and Piracy (February 2017) — launch coverage. All external figures verified September 2026.
This article was drafted with AI assistance and reviewed by our editorial team. All statistics are attributed to their publishing institutions; projections are labeled as such.